A click map is a marketing tool that helps businesses find out where users click on a specific web page, email, or interface. It allows marketers to understand user behavior and optimize engagement. By examining the links that users click on most often and pinpointing the areas that receive the most clicks, companies can enhance their websites, email campaigns, and landing pages to create a better user experience and achieve higher conversions.
In this article, we’ll explore the types of click maps and why marketers should use them. We’ll also show you how they work and unveil the 3 best click map tools for tracking user activities.
Why should marketers use click maps?
Click maps are essential for companies because they give marketers crucial information about users and help them make data-driven decisions. This applies to different areas of a business and helps do the following.
- Improve email campaigns. When you use click maps, you can easily monitor your subscribers' actions and determine which of your email elements drive the most actions. They allow you to understand what links work best with your audience and focus on optimizing your email campaigns. Moreover, you can adjust the placement of other links to drive more engagement and encourage conversions.
- Optimize your website and landing pages. You can effectively evaluate your website and landing page elements by analyzing call-to-action buttons and user interactions with them. By using click maps, you’ll discover how effective the placement of your CTAs is and adjust them for more clicks. Besides, they allow you to identify dead zones where there’s no interaction with your company.
- Improve customer experience. By continually monitoring and evaluating your website’s or email campaigns’ performance, you can pinpoint distractions and eliminate them. This leads to better navigation. When you remove confusing elements, your users can easily navigate your website and take the actions they desire. Furthermore, you can assess whether crucial content is positioned correctly to achieve the highest engagement. By placing essential content and links in high-click areas, you ensure greater satisfaction and enhance the user experience.
- Understand user behavior. With click maps, you can identify which elements generate the highest engagement, including buttons, links, and images that users interact with most often. Additionally, they enable you to see where users attempt to click but can’t because these elements are non-clickable, prompting you to consider adding links in these areas. This will help you increase interaction with your website, landing page, or email campaign.
- Increase conversions. You can A/B test several layouts and placements for your CTAs. This allows you to identify the perfect choice for your users. By doing this, you can ensure that people find everything they need quickly. You’ll lower bounce rates and increase conversion rates for your business.
Now that you know some of the most crucial reasons to incorporate click maps, it’s time to find out what types of them exist. This will help you identify the perfect one for your business.
Types of Click Maps
Depending on the insights provided by click maps, they can be categorized into several types. In this section, we will review each type.
- Heatmaps. These maps illustrate areas on your website or email campaign with the highest and lowest user activity. They use red to indicate high clicks and blue for low ones, allowing you to recognize what needs adjustment instantly. This type of analysis is particularly valuable for businesses aiming to pinpoint popular elements, assess the effectiveness of CTAs, and uncover inactive areas that require immediate attention. By reviewing heatmaps, you can enhance the layout, rethink the placement of calls to action and content, and identify sections that receive no interaction.
- Scroll maps. They indicate how much users scroll before leaving one of your web pages. Using this type of map allows you to effectively evaluate how engaging and absorbing the content on your web page is. Additionally, it helps you determine whether all the crucial elements are visible to users and understand why they lose interest before completing specific actions, such as making purchases, filling out subscription forms, downloading files, and more. This insight enables you to adjust the placement of CTAs and valuable content so that users can see them before drop-off points.
- Click maps. These indicate the specific areas on a web page where users frequently click and mark them with dots. Click maps enable you to discover which elements on your web page receive the most clicks and areas users attempt to click that are not clickable. By analyzing this information, you can determine how to position links and buttons effectively. Additionally, you can eliminate misleading elements and consider adding links to sections that users are trying to click.
- Hover maps. These respond to mouse movements and the typical patterns users exhibit on your website. This approach is suitable for marketers aiming to understand which areas attract the most user attention and to predict when visitors are likely to click. You can identify when your site visitors have hesitations. With hover maps, you can enhance engagement by optimizing content and positioning CTAs in the most effective locations. Additionally, you will discover which areas capture attention but lack call-to-action buttons.
- Attention maps. These maps help you identify which areas of your website attract the most attention. By understanding which elements engage well, you can optimize the visibility of your content and CTAs. This ensures that the content is placed correctly and the layout is ideal for site visitors.
Now that you know which types your business needs, let’s explain how they work.
How do they work?
To take advantage of click maps, you should understand how they work first. That’s why we’ll provide you with a short explanation in this section.
The process starts by gathering all the necessary data from your website or email campaigns. For this purpose, they use tracking scripts (usually JavaScript). These scripts help maps collect information about various user actions, including clicks on links, buttons, and images, mouse movement, and scrolling.
The next step involves analyzing data and presenting it in a visual format. The map illustrates all interactions within specific areas of your web page or email campaign. Once all the data is prepared, it is displayed according to the type of click map you use. Some of these maps show how users scroll through your web page, while others identify areas with the highest level of engagement.
When the click map is ready, marketers and UX designers scan it to determine what works and what doesn’t with their web pages or email campaigns. They identify areas that perform well and those that generate low levels of interaction. UX designers also focus on finding confusing elements and optimizing CTA placement and navigation.
Now that you know how click maps work, you can understand why you need to find a perfect service. This service will help you handle all data seamlessly and quickly.
3 Best Click Map Tools to Track User Activities
The best way to track interaction with your web pages or email campaigns is to select a special tool that will do everything automatically. This will allow you to optimize the performance of your website and email campaigns effectively.
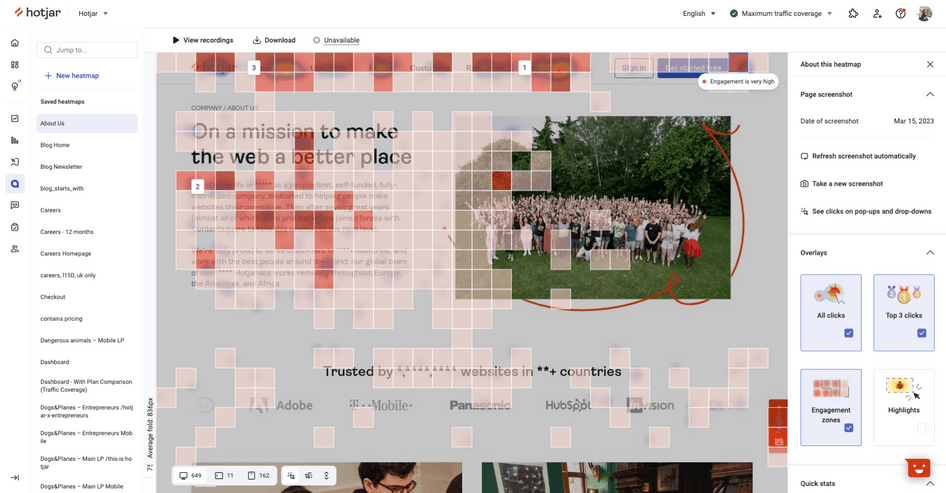
Hotjar
Hotjar is a platform that enables you to visualize user behavior using heatmaps. By tracking where users prefer to move, click, and scroll, you can improve the performance of your web pages and convert site visitors into customers without any obstacles.
When using the platform, you can identify elements that capture users’ attention and content that fails to engage them. After that, you can discover the reasons why people don’t explore specific pieces of content through rage-click maps. By reviewing the recordings, you can focus on areas that cause user frustration and seek solutions. Additionally, the service enables you to analyze how clicks evolve over time.
Pricing: The platform offers a free plan that includes 35 daily sessions, unlimited heatmaps, recordings of user sessions, basic filters, and more. If you need additional daily sessions, you’ll need to purchase a paid subscription, which starts at $33,23 monthly. This plan includes 100 daily sessions, page view filters, session information and technology filters, and events API for monitoring custom user actions.
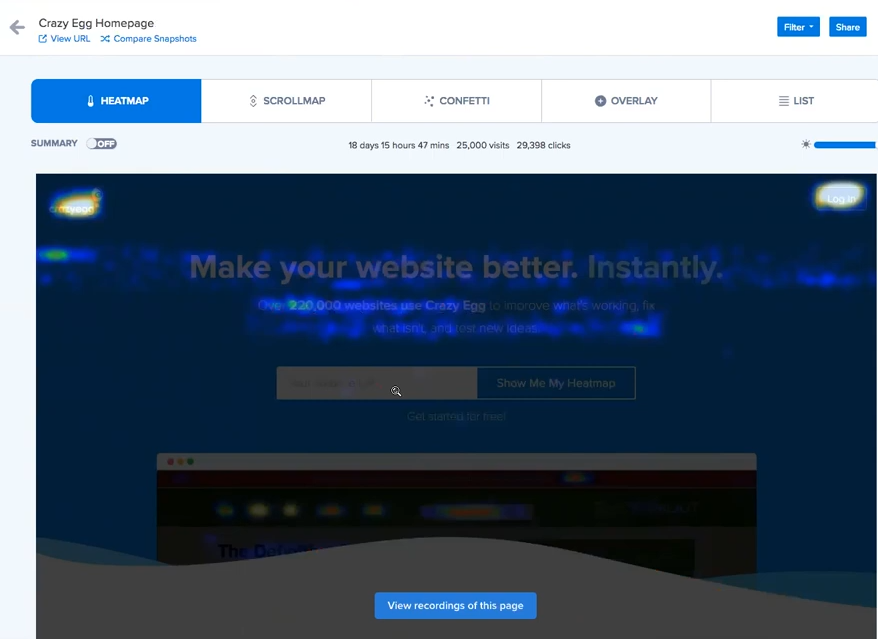
Crazy Egg
Crazy Egg is a service that helps you understand where users interact with your website using click maps, scroll maps, overlay maps, list maps, and confetti maps. With their help, you can optimize page design and boost conversions.
The platform provides all the essential features to identify top-performing pages, content, and CTAs, while also helping you understand which content is underperforming. Subsequently, you can optimize low-performing content so that users can focus on offers that drive action. Additionally, the service allows you to pinpoint issues related to dead space, missing links, and slow loading times. Addressing these problems will enhance your web page effectiveness.
Pricing: The tool offers a 30-day free trial to test its features. The cheapest paid plan costs $29 monthly and includes 5,000 tracked pageviews, 5 heatmap reports, and 50 recordings.
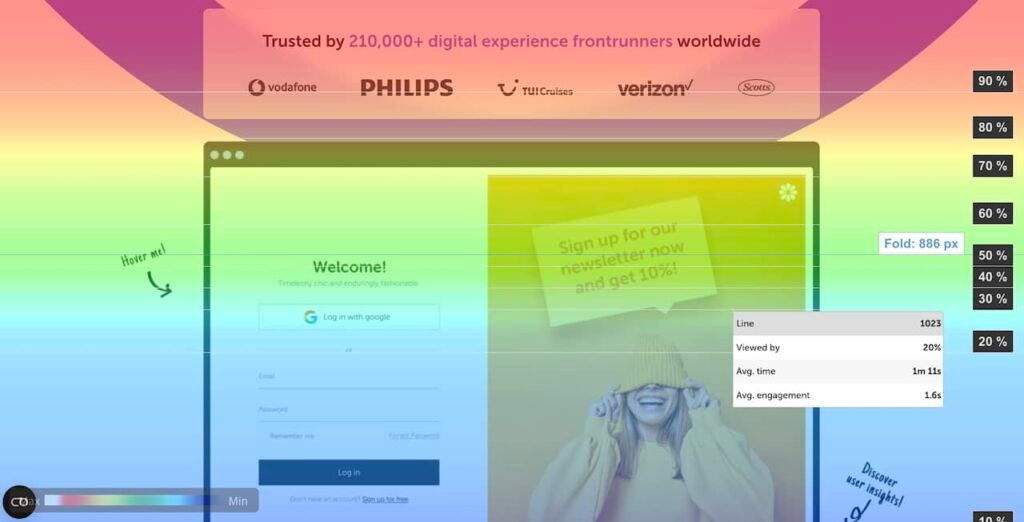
Mouseflow
Mouseflow empowers you to leverage heatmaps, session replays, and friction scores. These features help you understand user behavior and optimize your web pages. By reviewing visual reports on user interactions, you’ll stay informed about the quality of your CTAs, content, and other elements. The platform’s heatmap records all your traffic by default and covers every web page you need, enabling you to analyze user behavior more effectively.
Mouseflow’s heatmaps allow you to track users’ clicks, scrolls, attention, movements, and location. By visualizing this data, you can effectively develop strategies to enhance your web pages for better engagement and increased customer acquisition. Additionally, the service provides automatic Friction Scores to identify users who may be dissatisfied with your web pages.
Pricing: If you’re just starting your business or have a small team, you can use a free plan. It includes 500 sessions, essential behavior analytics, 500 user recordings, and one website project each month. When you need more sessions, consider a paid plan that costs $227.90 per month when paid annually. This plan offers 50,000 sessions, limited journey analytics, 50,000 user recordings, and 5 website projects.
All in all, click maps are excellent tools for understanding how users interact with your web pages. You can easily track clicks and discover which elements engage users the most. Having these insights readily available allows you to effectively optimize your website design, navigation, placement of CTAs, and content. Consequently, you’ll see more interactions and conversions.
Last Updated: 21.02.2025
or